Anchor case
PTS — Quality inspection system, from zero to production
Hired to design, build and maintain a system that turned field inspection from Excel spreadsheets into a reliable digital product.
What I found
The inspection operation ran on Excel: loose photos, measurements and defects typed by hand, outdated spreadsheet versions and reports assembled manually. The result was rework, error risk and no consolidated view of the operation.
I started by observing a real inspection in the field — without interfering — to map the actual workflow, exceptions included. From there, I separated business rules, states, data and automation points, and designed a system simple enough for the inspector to use in the field and robust enough to scale.
What I built
- Offline-first mobile app for field capture: photos, measurements, defects and evidence — working without internet, syncing automatically afterward.
- Web admin dashboard with real-time operational analytics, work queue, review workflow (creation, return, cancellation, no-show) and report generation.
- Backend and data-reliability rules — phase-based ownership to prevent conflict between field and back office, and consistent sync.
- AI and AI-assisted development to speed up documentation, QA, testing and the automation roadmap (checklists, standardized observations, defect classification).
Technical sheet — implemented capability
- Field capture
- Photos, measurements, defects and evidence recorded in the app without depending on a connection on site.
- Synchronization
- Automatic upload when the connection returns, with consistency guaranteed between field and back office.
- Ownership by phase
- Each stage has an owner in the system, which prevents field and back office from editing the same report at the same time.
- Review flow
- Creation, return, cancellation and no-show are states of the report — not arrangements made over chat.
- Work queue
- What is pending, with whom and for how long, visible in the admin dashboard.
- Operational analytics
- Quality and productivity consolidated in real time, with no spreadsheet in between.
- Reports
- Generated from what was captured: the report structure arrives already filled in by the field record.
- AI in development
- Applied to documentation, QA and testing, and to the automation roadmap — checklists, standardized observations and defect classification.
Role: Product Lead & Solution Architect, on contract, since Sep/2025. The system is in production and continuous operation — uptime, support, telemetry and preventive maintenance — remains my responsibility. No line in this sheet is an estimate: gains, percentages and projections stay in the diagnostic, under the estimated-impact label.
How the system works, in the order it runs
Field — the inspection is recorded where it happens
 View full size
Field inspection with the mobile app. App — the work queue runs without internet
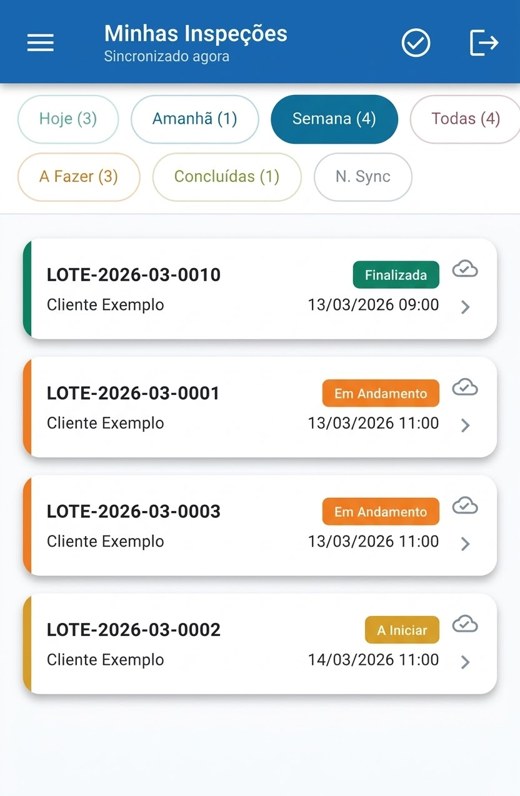 View full size
Mobile app — inspection list, offline-first. Back office — the same record reaches the dashboard consolidated
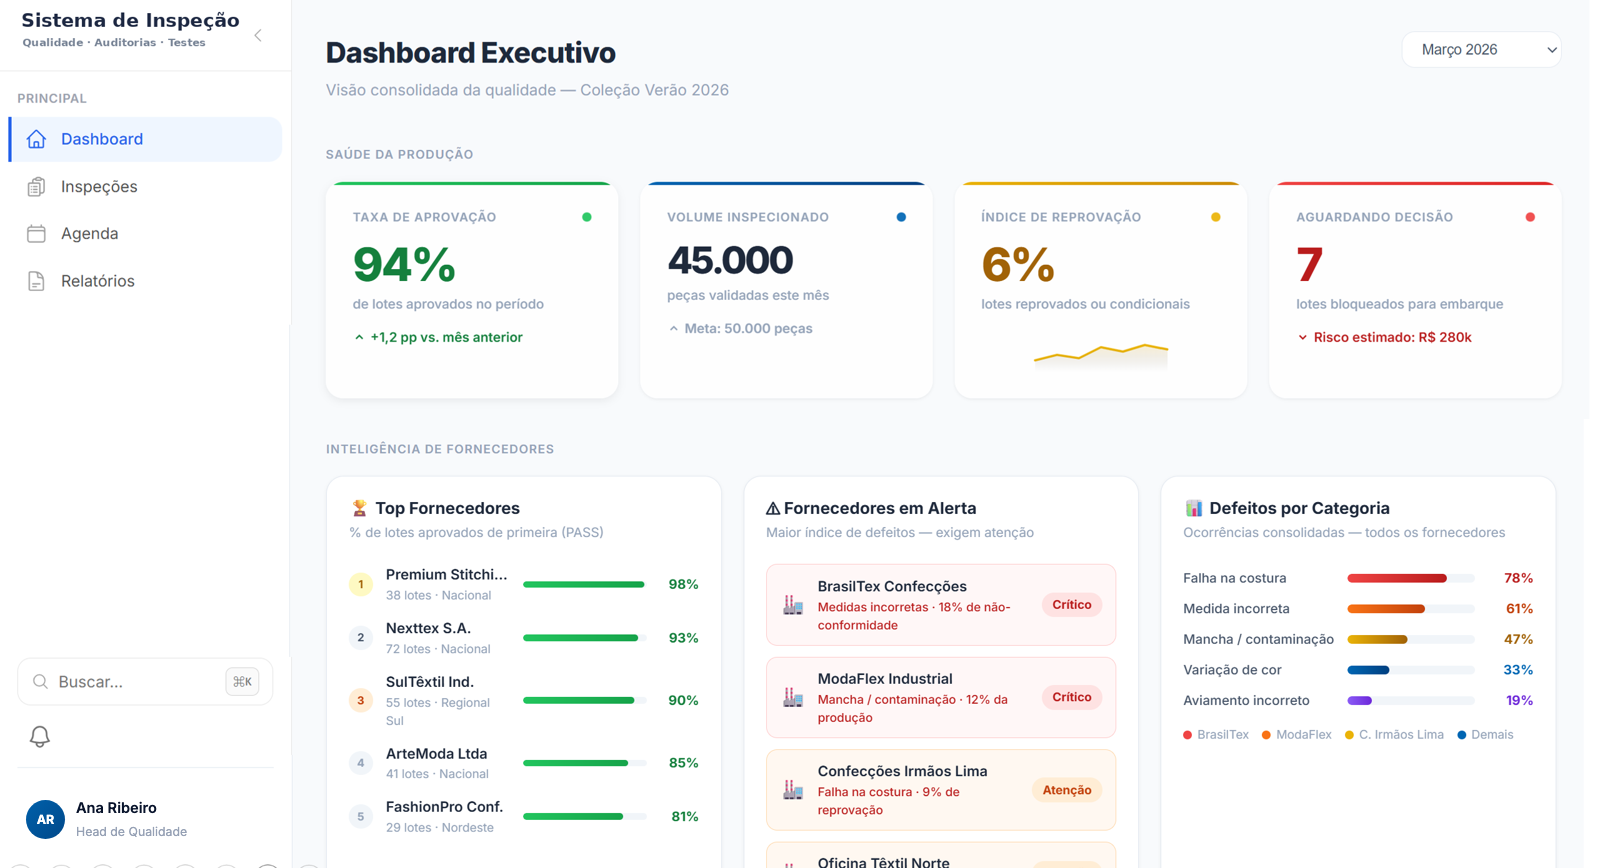 View full size
Executive dashboard — consolidated quality in real time.
Screens with demo data; client identity preserved.
What changed in the operation
What used to be a manual Excel process became a system in production, with standardized field capture, traceability and real-time managerial visibility. I remain responsible for ongoing operation — uptime, support, telemetry and preventive maintenance.
Estimated productivity gains and rework reduction were modeled in the proposal and can be shared on request.